No data or dashboards will be shown for this project in order to respect client confidentiality.
Introduction
Carmeuse, a major player in the construction materials industry, enlisted my services as a data analyst consultant to optimize and redesign their existing dashboards. The primary objective was to meet the company’s growing needs in performance management and decision-making by improving the quality and readability of KPI reports aimed at executive leadership.
My role was to make these dashboards more aesthetically pleasing, ergonomic, and interactive, thereby facilitating the understanding and use of key performance indicators (KPIs). The company also sought to improve the adoption of these tools while optimizing decision-making processes at the executive level.
Company Expectations
Carmeuse had specific expectations for its dashboards, including:
- Improved readability: Making reports more intuitive and clear to aid decision-making.
- Redesign of the interface: Enhancing ergonomics and visual design to ensure better adoption by executives.
- Simplified access to information: Making financial indicators like Free Cash Flow (FCF) and EBITDA more accessible and understandable across all levels of management.
- Key metrics tracking: Allowing comparative analysis with annual objectives and previous year performance (Y-1).
Methodology
As a consultant, I followed a rigorous methodology to meet these expectations:
-
Needs analysis: From the start of the project, I worked closely with Carmeuse’s CFO and Power BI manager to define the exact financial reporting needs. This ensured the dashboards aligned with the company’s strategic requirements.
-
Dashboard design: After identifying the needs, I began redesigning the dashboards using Power BI. I employed DAX language to develop complex measures and enhance the tracking of financial indicators such as FCF and EBITDA.
-
Technical collaboration: I worked with Carmeuse’s BI manager, who provided valuable support in data integration and the creation of advanced visuals.
-
Testing and adjustments: Following the creation of the dashboards, several testing cycles were conducted with the CFO and other executives to validate the functionality and usability of the tools.
Results for the Company
The results of this project exceeded Carmeuse’s expectations:
- Complete dashboard overhaul: KPI reports were restructured for improved readability and clarity, facilitating decision-making by senior executives.
- Additional features: Beyond the initial expectations, I integrated a mobile version of the dashboards and a dark mode for better visibility in bright environments, which was well-received by the leadership.
- Increased adoption: Thanks to these improvements, dashboard adoption by the management teams significantly increased.
Additional Initiatives
In addition to the original objectives, I proposed further innovations:
- Dark mode: This feature improves dashboard visibility in bright environments.
- Mobile version: I developed a mobile version to enable executives to access reports at any time, increasing their responsiveness to market changes.
- Custom financial measures: I created complex financial metrics using DAX language, optimizing the tracking of FCF and EBITDA.
Skills Developed
Here are the skills I developed during this project:
- Power BI: Designing high-performance dashboards, advanced use of DAX language for developing complex measures, and optimizing the KPI structure.
- Financial analysis: Deep understanding of key financial indicators such as FCF and EBITDA, aligning reporting metrics with Carmeuse’s financial objectives.
- Problem-solving: Identifying inefficiencies in previous dashboards and proposing solutions to improve financial performance.
- Project management: Ability to manage the project independently, meet deadlines, prioritize tasks, and collaborate with various stakeholders.
- Stakeholder engagement: Effective communication with the CFO and technical leads, understanding business needs, and translating them into appropriate technical solutions.
- Business acumen: Gaining a comprehensive view of the company’s financial processes, ensuring that the dashboards support Carmeuse’s strategic objectives.
Conclusion
The project at Carmeuse was a resounding success, delivering results that surpassed the company’s initial expectations. I was able to optimize the Power BI dashboards, enhance the visibility of financial KPIs, and offer innovative solutions such as mobile access and dark mode. This experience not only strengthened my expertise in business intelligence but also provided Carmeuse with more effective reporting tools aligned with their strategic needs.
Finally, this mission bolstered Intys Consulting’s credibility in delivering tailored business intelligence solutions while highlighting our ability to understand and address business challenges efficiently and innovatively.
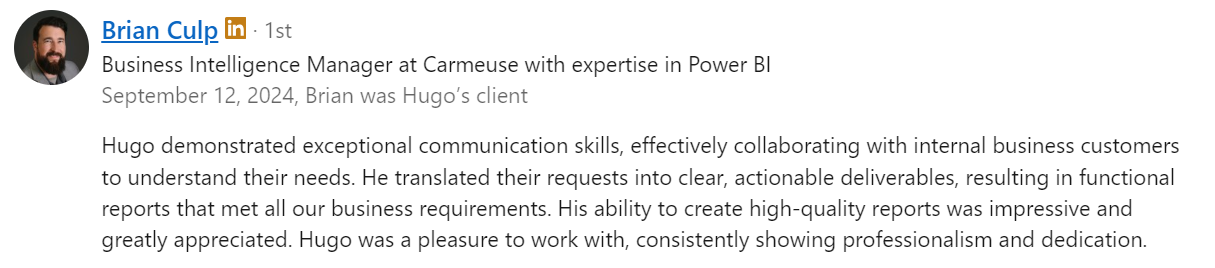
Recommendations from my manager.