
Project Overview:
The objective is to analyze a real-world dataset from a fictional recruitment company named DataSearch. Leveraging previous knowledge, the task involves using Power Query to explore and cleanse the data, focusing on identifying the most in-demand skills for data scientists, data analysts, and data engineers. Subsequently, utilizing DAX, the aim is to construct meaningful visualizations to depict the insights gleaned. Finally, the goal is to synthesize these findings into a comprehensive business dashboard, facilitating the provision of actionable insights to the DataSearch team.
Exploratory Data Analysis:
The initial phase of our analysis involves conducting an exploratory data analysis (EDA) to gain a comprehensive understanding of the dataset. We’ll utilize Power Query to investigate and clean the data, ensuring its quality and reliability for subsequent analysis. Key tasks during the EDA phase include:
- Data Cleaning: Identifying and rectifying inconsistencies, missing values, and anomalies within the dataset to ensure data integrity.
- Attribute Exploration: Exploring the qualitative and quantitative attributes to discern patterns, trends, and potential insights.
- Skill Demand Analysis: Analyzing the required skills across different job roles (data scientists, data analysts, data engineers) to identify commonalities and unique skill sets.
- Temporal Trends: Investigating temporal trends such as job posting frequency over the five-year period and seasonal variations, if any. By meticulously examining the dataset and employing appropriate data cleaning techniques, we lay the foundation for insightful analysis and visualization in subsequent stages.
Visualization and Dashboard Creation:
In this phase, we leverage DAX (Data Analysis Expressions) and Power BI’s visualization capabilities to create meaningful insights from the cleaned dataset. We aim to transform raw data into actionable insights through interactive visualizations and a comprehensive business dashboard. Key components of this phase include:
- Metric Definition: Defining relevant metrics and KPIs (Key Performance Indicators) based on the insights garnered during the exploratory analysis phase.
- Visualization Design: Crafting visually appealing and informative charts, graphs, and tables to present key findings effectively.
- Dashboard Development: Integrating individual visualizations into a cohesive dashboard layout that enables easy navigation and interpretation for end-users.
- Interactivity and User Experience: Enhancing the dashboard with interactive features such as filters, slicers, and tooltips to facilitate user-driven exploration and analysis. By synthesizing the findings from our exploratory analysis into a compelling dashboard, we empower the DataSearch team to derive actionable insights and make data-driven decisions regarding job market trends in the data science industry.
First dashboard: Home dashboard
Navigating through button :
The first dashboard features three buttons in the middle. The left button navigates to the Jobs dashboard, the middle one to Skills, and the third to Company information.
Jobs dashboard:
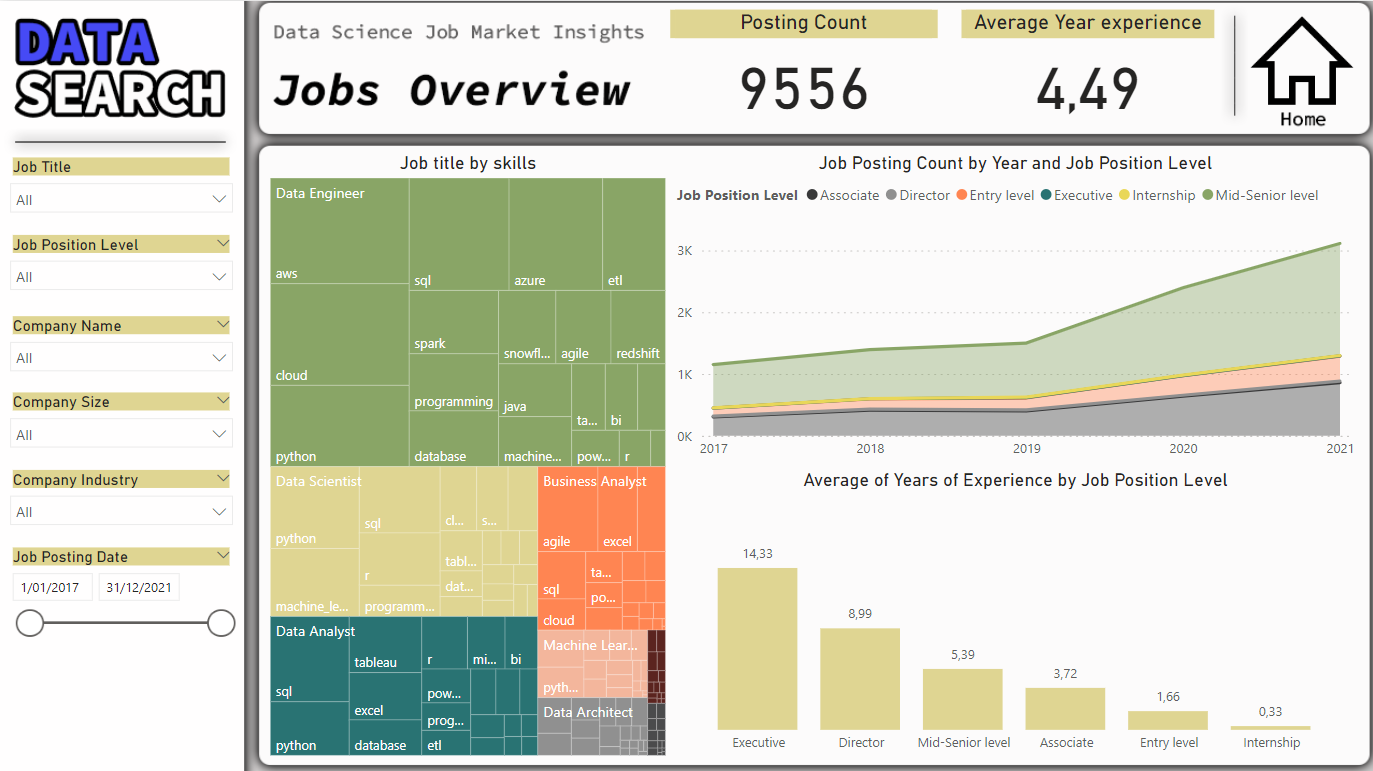
Empowering Recruitment Strategy with Detailed Job Analysis
This dashboard layout was designed to facilitate comprehensive job market analysis. The left-side filters provide flexibility in selecting search criteria. The top KPIs offer key insights for quick assessment of the overall market situation. The accompanying graphs provide clear visualizations of trends, such as most in-demand skills, temporal evolution of job postings, and required experience levels, thereby enabling in-depth analysis and informed decision-making for recruitment purposes.
Skills Dashboard:
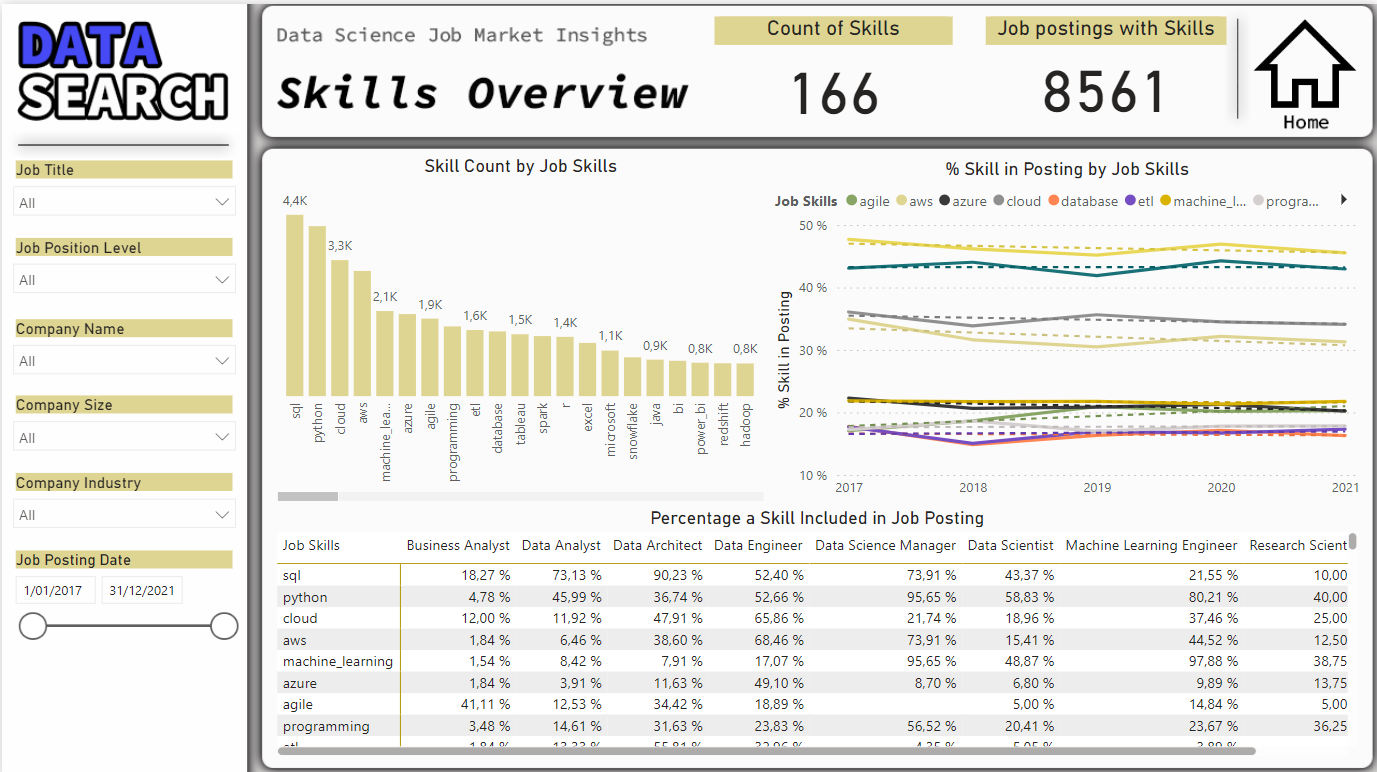
Dynamic Skill Analysis
The second dashboard was created to provide a comprehensive analysis of the skills required in job postings over time, along with their distribution across different job titles. This approach allows for a clear visualization of trends in sought-after skills, identification of the most in-demand skills, and understanding how these requirements evolve annually. By combining this information, recruiters can make informed decisions regarding candidate skill development and their company’s recruitment strategy.
Company Dashboard:
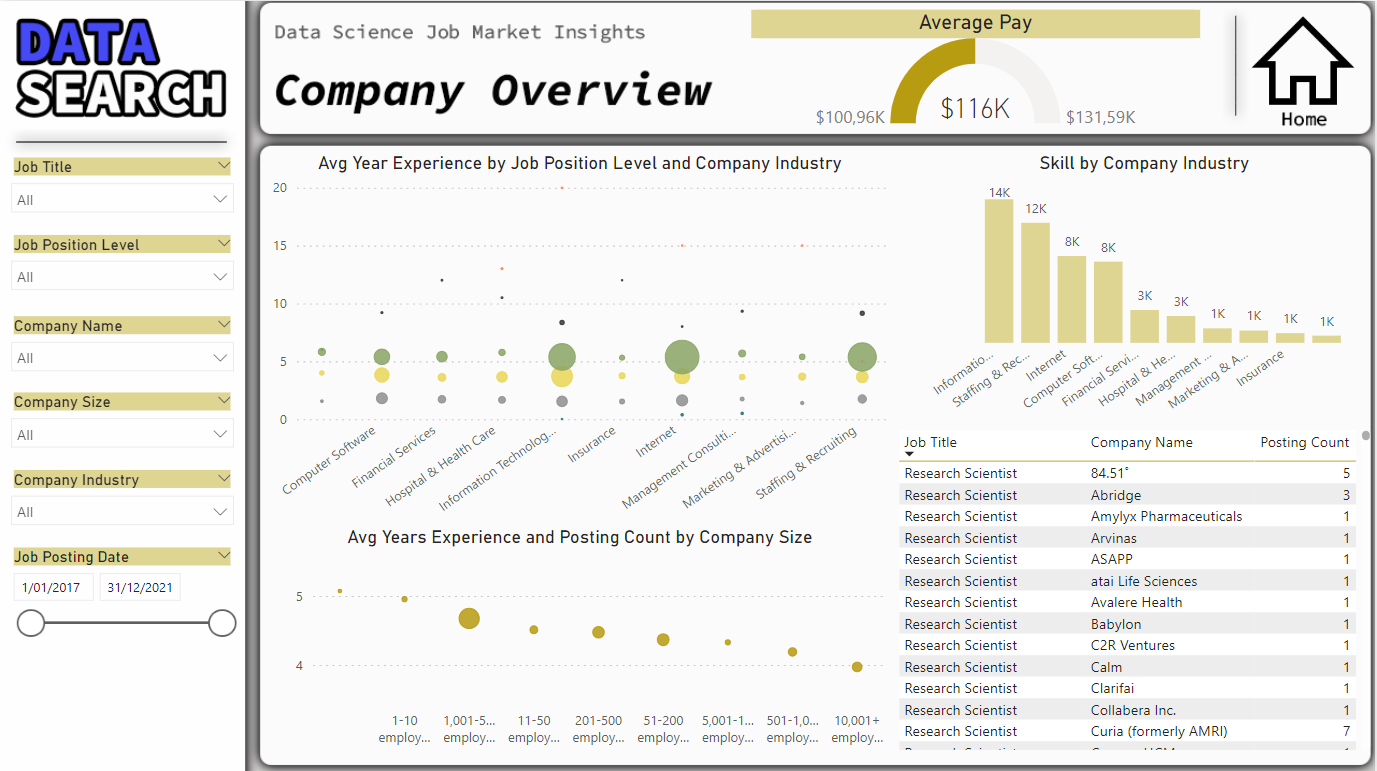
Exploring Company Context
This choice of dashboard design for enterprise data analysis is relevant as it enables a comprehensive understanding of labor market trends, skill requirements, and compensation levels. The visual representations facilitate the identification of key insights for recruitment and business development decisions. For instance, the average pay gauge provides an immediate indication of salary levels, while the graph depicting required skills by company highlights the most sought-after skills across industries. By amalgamating these insights, decision-makers can devise targeted recruitment strategies and adjust compensation policies to remain competitive in the market.