Visual Analysis of Film Data
Introduction: This project involved the analysis and visualization of film data extracted from IMDb and Allociné. Visualization played a crucial role in making cinematic trends accessible and understandable.
Data Collection and Preprocessing: Web scraping techniques were used to gather detailed information about films, including titles, release years, genres, directors, and actors, from various online sources.
Visual Analysis: Matplotlib library was utilized to create informative visualizations:
- Film Distribution by Genre: A bar chart depicted the number of films in each genre, with an overlay of average ratings represented by red dots, providing a detailed view of the most frequent and highest-rated genres.
- Global Genre Distribution: A pie chart presented the overall distribution of films by genre in percentage, offering a visual perspective of genre distribution within IMDb’s top 250.
- Average Ratings Evolution by Decade: A line graph showcased how the average rating of films changes across decades, offering an insight into rating trends over time.
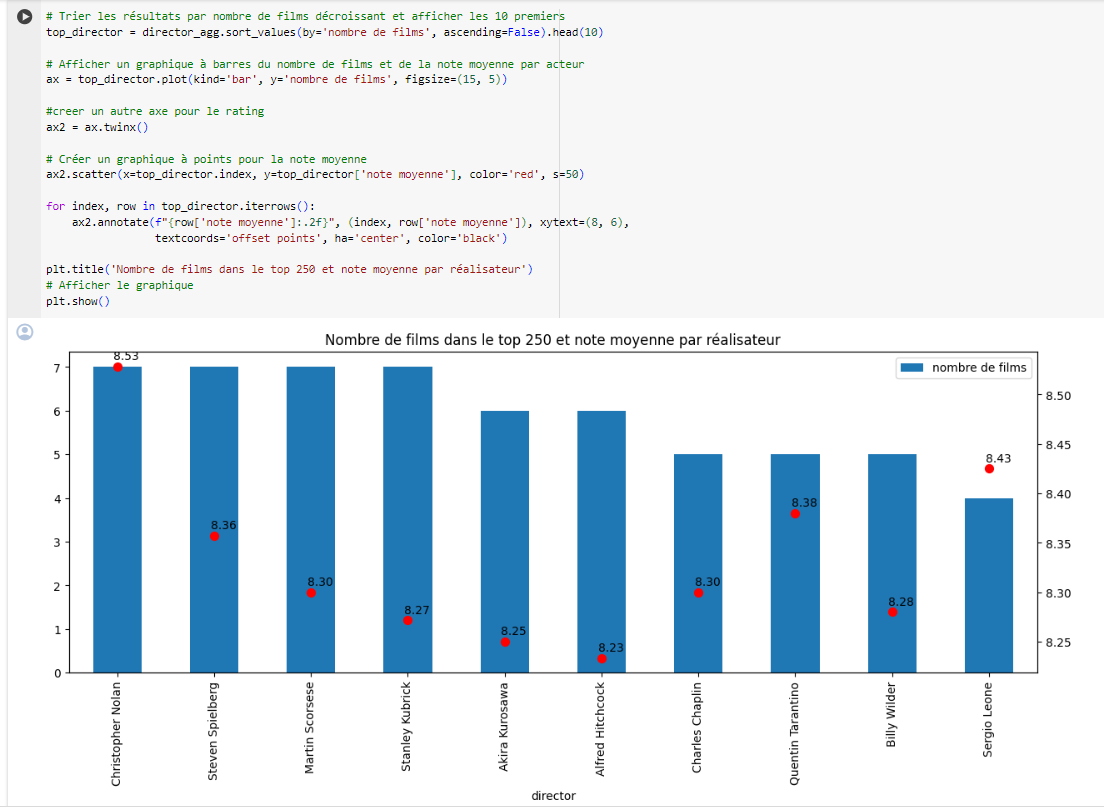
- Director Performance: A bar chart highlighted the number of films directed by the most prolific directors, visually indicating their performance in terms of average ratings.
Conclusion: Visualizing the data extracted significant insights into cinematic trends, highlighting dominant genres, the evolution of average ratings over the years, and director performances within IMDb’s top 250.
Impact and Acquired Skills: This experience strengthened my ability to transform raw data into clear and informative visualizations, showcasing proficiency in visual analysis tools to present relevant insights from complex data.